Creating Dynamic Filter Based on Tab Selection
Use Report Studio to get the following end result.
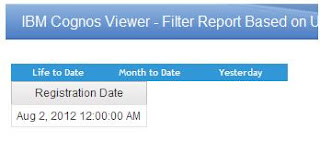
(Yesterday)
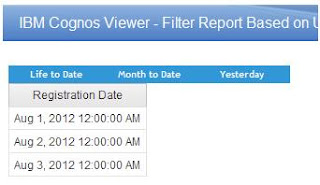
(Month to Date)
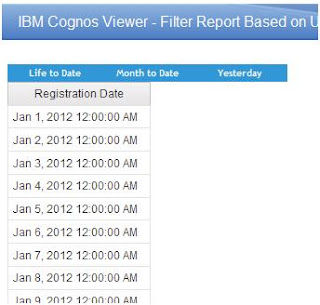
(Life to Date)
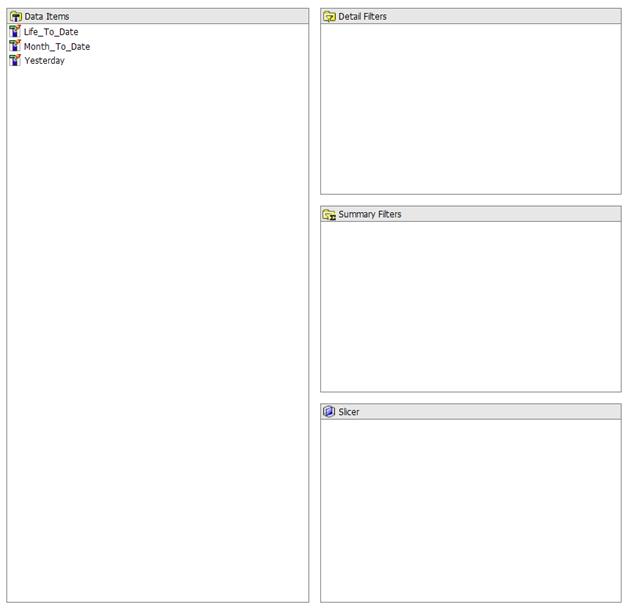
Create a Query
Create a new query to be used solely to hold the tab values. Call it “TimeFrame Query” and create data items for every time frame that you’d like to appear. The expression definition should be a string encapsulated in single quotes.
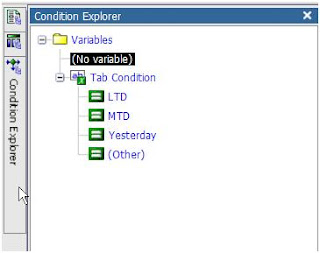
Create a String Variable
Next let’s go ahead and create a string variable called “Tab Condition”. Define the expression as shown below:
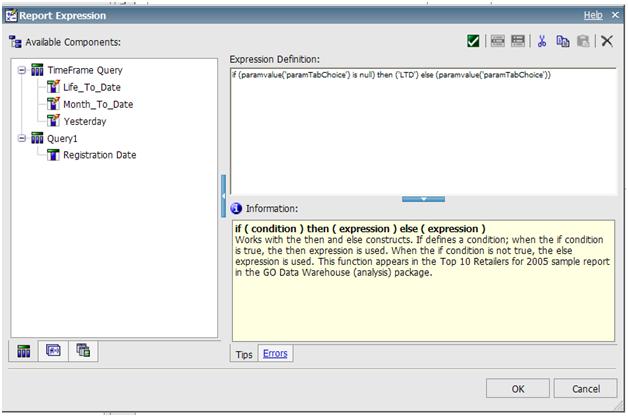
if (paramvalue('paramTabChoice') is null) then ('LTD') else (paramvalue('paramTabChoice'))
This expression will set a default tab value for the report.
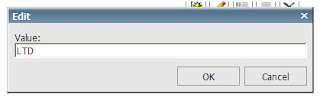
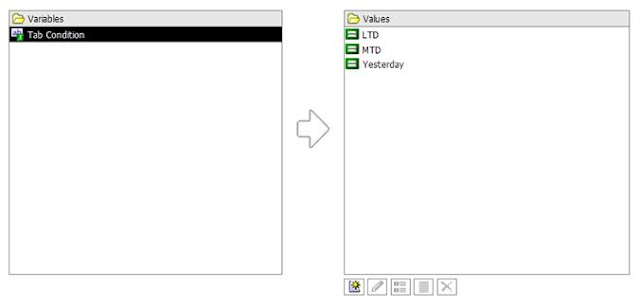
Next, we will need to create a string value to correspond to every data item we created in the query.
Note: The values of this variable must exactly match the expression definition of the data items we created. It is not necessary to use single quotes when defining the values of the string variable.
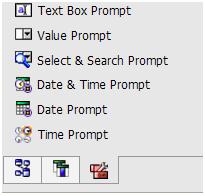
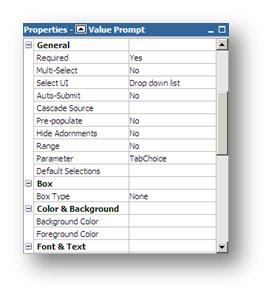
Create a Hidden Value Prompt
Drag a value prompt onto the page. Name the parameter “paramTabChoice” within the prompt wizard and click “Finish”
Once created, within the properties menu, set the Box Type to “None” in order to make this prompt disappear.
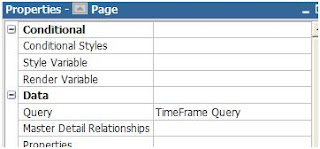
Associate the Query to the Page
Navigate to the page explorer. Select the page we are working on and associate it to the TimeFrame Query we created in the earlier steps.
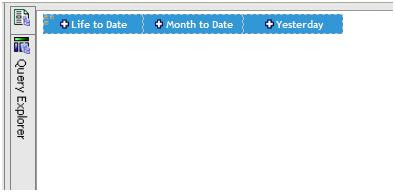
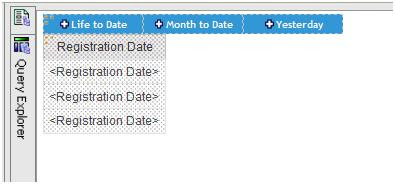
Create Tabs
Navigate back to the report and drag a table object onto the page. Define it with 3 columns and 1 row. Drag Text Items into each one of these cells and name them appropriately with each time frame (Month to date, Life to Date, Yesterday etc). Add 20px of padding to each one of these cells.
Add Data Object
Add List, Crosstab, Chart etc field under the table inserted above.
Create Filter Based on Selected Tab
Select the data object, right click and select filter. Create filter using advanced option. Enter the below IF ELSE condition for this example.
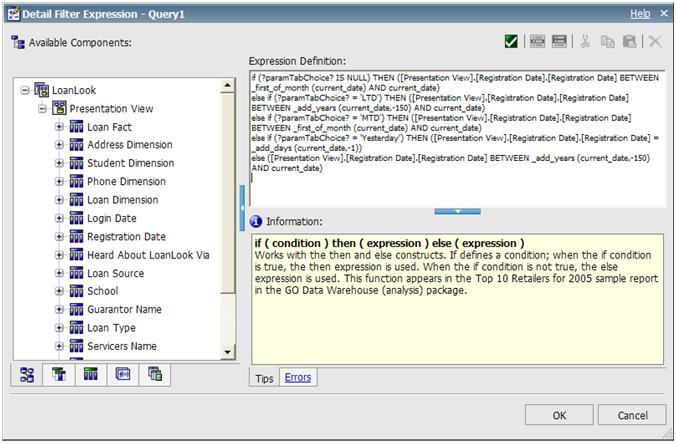
if (?paramTabChoice? IS NULL) THEN ([Presentation View].[Registration Date].[Registration Date] BETWEEN _first_of_month (current_date) AND current_date)
else if (?paramTabChoice? = 'LTD') THEN ([Presentation View].[Registration Date].[Registration Date] BETWEEN _add_years (current_date,-150) AND current_date)
else if (?paramTabChoice? = 'MTD') THEN ([Presentation View].[Registration Date].[Registration Date] BETWEEN _first_of_month (current_date) AND current_date)
else if (?paramTabChoice? = 'Yesterday') THEN ([Presentation View].[Registration Date].[Registration Date] = _add_days (current_date,-1))
else ([Presentation View].[Registration Date].[Registration Date] BETWEEN _add_years (current_date,-150) AND current_date)
Run the report and test!
With help from: http://www.ironsidegroup.com/2011/11/14/ibm-cognos-tabbed-report-design/
Use Report Studio to get the following end result.
(Yesterday)

(Month to Date)

(Life to Date)

Create a Query
Create a new query to be used solely to hold the tab values. Call it “TimeFrame Query” and create data items for every time frame that you’d like to appear. The expression definition should be a string encapsulated in single quotes.

Create a String Variable
Next let’s go ahead and create a string variable called “Tab Condition”. Define the expression as shown below:


if (paramvalue('paramTabChoice') is null) then ('LTD') else (paramvalue('paramTabChoice'))
This expression will set a default tab value for the report.
Next, we will need to create a string value to correspond to every data item we created in the query.
Note: The values of this variable must exactly match the expression definition of the data items we created. It is not necessary to use single quotes when defining the values of the string variable.


Create a Hidden Value Prompt
Drag a value prompt onto the page. Name the parameter “paramTabChoice” within the prompt wizard and click “Finish”
Once created, within the properties menu, set the Box Type to “None” in order to make this prompt disappear.

Associate the Query to the Page
Navigate to the page explorer. Select the page we are working on and associate it to the TimeFrame Query we created in the earlier steps.

Create Tabs
Navigate back to the report and drag a table object onto the page. Define it with 3 columns and 1 row. Drag Text Items into each one of these cells and name them appropriately with each time frame (Month to date, Life to Date, Yesterday etc). Add 20px of padding to each one of these cells.

Add Data Object
Add List, Crosstab, Chart etc field under the table inserted above.

Create Filter Based on Selected Tab
Select the data object, right click and select filter. Create filter using advanced option. Enter the below IF ELSE condition for this example.
if (?paramTabChoice? IS NULL) THEN ([Presentation View].[Registration Date].[Registration Date] BETWEEN _first_of_month (current_date) AND current_date)
else if (?paramTabChoice? = 'LTD') THEN ([Presentation View].[Registration Date].[Registration Date] BETWEEN _add_years (current_date,-150) AND current_date)
else if (?paramTabChoice? = 'MTD') THEN ([Presentation View].[Registration Date].[Registration Date] BETWEEN _first_of_month (current_date) AND current_date)
else if (?paramTabChoice? = 'Yesterday') THEN ([Presentation View].[Registration Date].[Registration Date] = _add_days (current_date,-1))
else ([Presentation View].[Registration Date].[Registration Date] BETWEEN _add_years (current_date,-150) AND current_date)
Run the report and test!
With help from: http://www.ironsidegroup.com/2011/11/14/ibm-cognos-tabbed-report-design/
Comments